
Notice
Recent Posts
Recent Comments
Link
| 일 | 월 | 화 | 수 | 목 | 금 | 토 |
|---|---|---|---|---|---|---|
| 1 | 2 | 3 | 4 | 5 | ||
| 6 | 7 | 8 | 9 | 10 | 11 | 12 |
| 13 | 14 | 15 | 16 | 17 | 18 | 19 |
| 20 | 21 | 22 | 23 | 24 | 25 | 26 |
| 27 | 28 | 29 | 30 |
Tags
- decimal error
- iterrows
- implicitData
- TensorflowDeveloperCertificate
- gluonnlp
- MatrixFactorization
- ExplicitData
- Visualization
- Convert
- Cast
- Colab
- session-basedRecommendation
- MySQL
- github2FA
- wordembedding
- vscode
- 지도시각화
- LatentFactorModel
- 텐서플로자격증
- json
- jsonlines
- jsonl
- str.replace
- BloombergMarketConcepts
- numpy.bool
- DIF_SR
- pandas
- VScodeNotResponding
- Python
- sshtunnel
Archives
- Today
- Total
garret
[Python] seaborn 그래프 위에 숫자 표시하기 본문
사용데이터: Dacon의 영화 관람객 데이터
영화 관객수 예측 경진대회 - DACON
분석시각화 대회 코드 공유 게시물은 내용 확인 후 좋아요(투표) 가능합니다.
dacon.io
데이터 불러오기
간단하게 train 데이터만 불러왔다
train = pd.read_csv('movies_train.csv')데이터의 컬럼 구성은 아래와 같다
- title: 영화 제목
- distributor: 배급사
- genre : 장르
- release_time: 개봉일
- time: 상영시간(분)
- screening_rat : 상영등급
- director: 감독이름
- dir_prev_bfnum : 해당감독이 이 영화를 만들기 전 제작에 참여한 영화에서의 평균 관객수(단 관객수가 알려지지 않은 영화 제외)
- dif_prev_num : 해당감독이 이 영화를 만들기 전 제작에 참여한 영화의 개수(단, 관객수가 알려지지 않은 영화 제외)
- num_staff : 스텝수
- num_actor: 주연배우수
- box_off_num: 관객수
seaborn 그래프 그리기
import seaborn as sns

ax= sns.countplot(x='genre',data=train, order=train['genre'].value_counts().index)

for p in ax.patches:
  height = p.get_height()
  ax.text(p.get_x() + p.get_width() / 2., height + 3, height, ha = 'center', size = 9)
ax.set_ylim(0,250)
plt.xticks(rotation=45)

plt.title('장르별 영화 개수')
plt.show()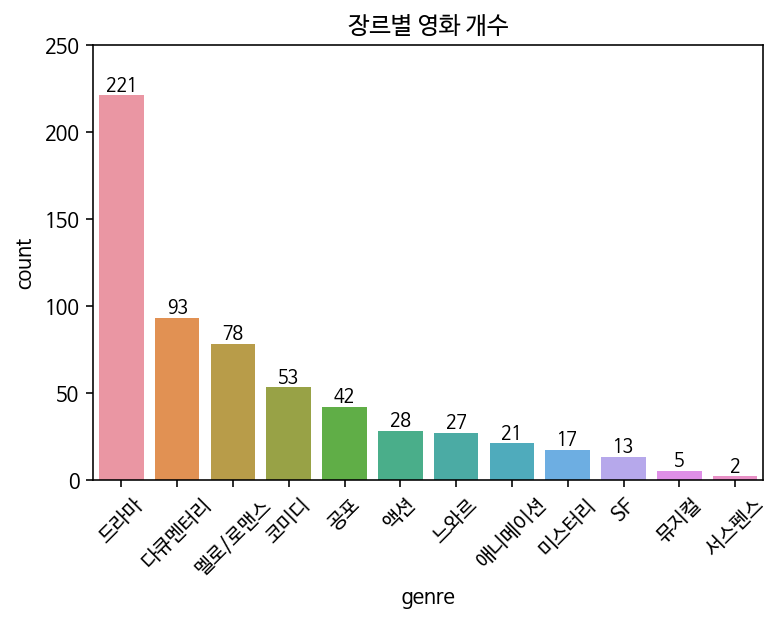
get_height(): bar의 세로길이
get_width() : bar의 가로길이
get_x() : x축의 가장 왼쪽 부분
추가 - 반올림한 값을 text로 넣고 싶을 때
ax.text(p.get_x() + p.get_width() / 2., height + 3, round(height,1), ha = 'center', size = 9)get_height()한 값, height에 round함수 적용
참고 : round()
1의 자리에서 반올림 : round(num,-1)
10의 자리에서 반올림: round(num,-2)
소수 첫번째 자리에서 반올림: round(num)
소수 두번째 자리에서 반올림: round(num,1)
'Data > Data visualization' 카테고리의 다른 글
| [Python] Colab에서 한글 폰트 설치 (0) | 2023.03.09 |
|---|---|
| [Python, pydeck] colab에서 동물병원 데이터 시각화 2 (0) | 2023.01.07 |
| [Python, folium] colab에서 동물병원 데이터 시각화 1 (0) | 2023.01.07 |
'Data/Data visualization' Related Articles
more


